
Which Report Answers What
What each report is for, the rule that governs all of them, and why two can disagree.
Most questions have one obvious report and several that will nearly answer them.
| You want to know | Open |
|---|---|
| What a month was worth | Sales Summary |
| How a particular fortnight went | Sales Report |
| What sold, and what did not | Products Report |
| Who buys, and who came back | Customers Report |
| What carriage cost you | Shipping Report |
| What you owe, and where | Tax Report |
| What is on the shelf | Inventory Report |
| Whether a code was worth running | Coupon Report |
| What people searched for and did not find | Search Terms Report |
| What is owed to you | Invoice Aging Report |
| How a subscription base is moving | Subscription Report |
| What a vendor is owed | Vendor Report |
Some of these need a higher plan
The basic sales figures are on every plan. The advanced reports are not. If a report named here is missing from your menu, check What Your Plan Includes.
The Rule That Applies to All of Them
Every report counts money that was actually taken. Cancelled, refunded, failed and unpaid orders are left out.
This is why a report never matches your order list
Count the orders on screen, add them up by hand, and you get a bigger number, because the orders waiting to be paid are in that list and not in the report. Both numbers are right. They answer different questions.
Reports also count by when an order was placed, not when it was paid. An order placed in March and paid in April belongs to March, and appears there as soon as it is marked paid.
Sales Summary
A year of trading, a month to a row. The one to close a month with.
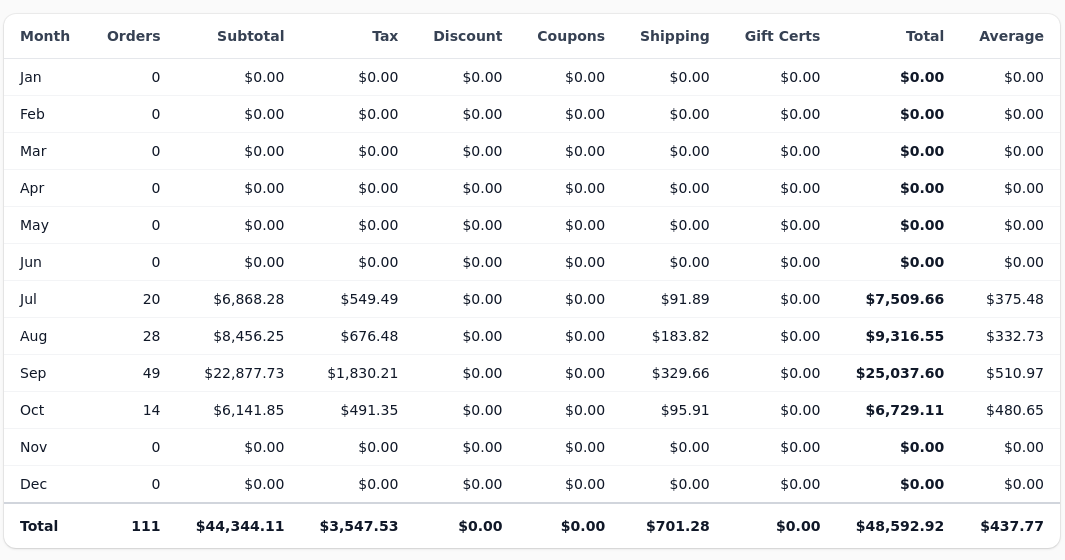
Columns run left to right from what was sold to what was left: orders, subtotal, tax, discount, coupons, shipping, gift certificates, total, and average order value, with the year's totals along the bottom. Export CSV gives your bookkeeper the same table.
A month reading zero means no orders were paid in it, not that nothing happened.
Sales Report
A date range rather than a year, with a chart and a day by day breakdown. Use it to look at a campaign, a weekend, or the fortnight either side of a change.
Products Report
Best and worst sellers for a range, and the same range broken down by category and by publisher or brand.
Why the category column adds up to more than you sold
A product sits in several categories at once and counts towards each one it belongs to. The question is how a subject performed, not how the subjects divide the takings.
The worst sellers list is the more useful half. It shows what is taking up shelf space.
Customers Report
Who spends, who returns, and who ordered once and never again. New against returning over a period tells you whether marketing is bringing people back or only bringing them.
Inventory Report
What is on the shelf, what is low, and what is out. Check it before a sale rather than after.
Invoice Aging Report
Unpaid orders grouped by how overdue they are. If you sell on terms this is the one that gets you paid.
Search Terms Report
What shoppers typed into your search box, and which searches returned nothing. A term with many searches and no results is either a product you should stock or a word your catalogue does not use.
Shipping Report
What you charged for carriage against what it cost, by carrier and service.
This is the report that tells you whether your flat rate is losing money. A shop charging one price and paying carrier rates discovers the gap here rather than at the end of the year.
Coupon Report
Uses and total discount given per code. Read it beside the Sales Report.
A code with many uses and a low average order value got shared beyond its audience, or discounted people who would have bought anyway. A code with few uses and a high average order value is usually the better campaign even though it looks quieter.
Vendor Report
If you sell on behalf of others, what each is owed for a period, based on what actually sold and was paid for.
Subscription Report
Active subscriptions, what they are worth per cycle, and what has lapsed. The number to watch is not the total but the direction: more lapsing than starting is a trend that takes months to show up in revenue.
Exporting
Most reports export to CSV. That is the right way to hand something to a bookkeeper, because it carries the figures rather than a picture of them, and they can check your arithmetic.
Export rather than screenshot. A screenshot of a report is a number nobody can verify.
If Two Reports Disagree
Check four things, in this order.
The date range. It rarely means what you assumed, and this month against the last thirty days is the most common mismatch.
The date basis. Everything counts from when an order was placed, not when it was paid. An order placed in March and paid in April belongs to March and appears there the moment it is marked paid, which can change a month you had already closed.
Unpaid orders. Almost every discrepancy between a report and a list of orders is an order waiting to be paid.
Refunds. A refund reduces the period the original order falls in, not the period the refund happened in.
A Monthly Routine
Open Sales Summary at the start of the month for the month just gone. Export it. Check the order count against your order list filtered to that month and to paid orders only: they should match exactly. If they do not, you have an order marked paid since you last looked, which is fine, or one that should have been and has not been, which is not.
Then open the Invoice Aging Report and chase anything older than your terms.