
Reading the Dashboard
What each figure counts, what it leaves out, how to read the charts, and where to look when one seems wrong.
The dashboard is the first thing you see, and its numbers are narrower than they look. Knowing what they exclude is the difference between trusting them and double checking them.
The Figures Along the Top

Revenue today and this month count money that was actually taken. An order that was cancelled or refunded is left out, and so is one whose payment failed or has not been paid yet.
If the figure looks lower than you expected
Cheque and purchase order sales sit outside revenue until somebody marks them paid, at which point they join it, dated to when the order was placed rather than when you marked it. That is the usual explanation. The Sales Summary report shows the same money a month at a time and is quicker to read for this.
Orders today counts orders on the same basis, so an unpaid order is not in it either. If you take a lot of offline payment, this figure will routinely read lower than the number of orders you can see in the list, and that is correct rather than a fault.
New customers counts accounts created this month. It does not count guests, because no account was created. A shop where most people check out as guests will show a small number here while selling perfectly well.
Average order value is this month's revenue divided by this month's orders, so it moves when either does. A single large trade order moves it noticeably in a quiet month, which is worth remembering before reading anything into a change.
The small line under each figure is the same measure for the month, with an arrow comparing it to the month before. The arrow is a direction, not a forecast: comparing the fourth of this month against a whole previous month will always look alarming.
The Charts
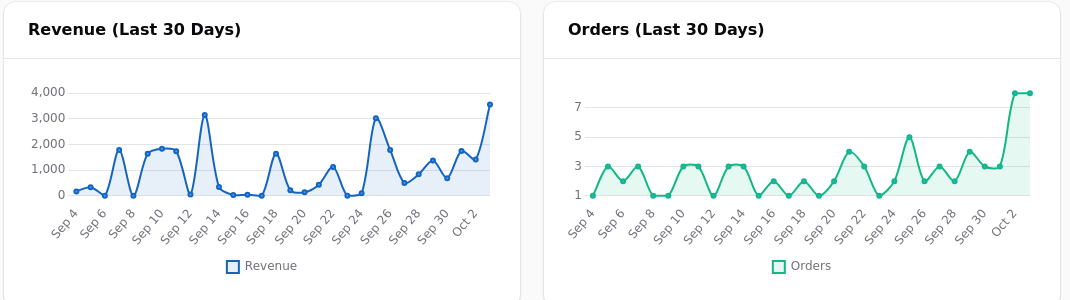
Both cover the last thirty days and use the same rule about which orders count.
Read them together. Revenue up while orders are flat means people are spending more each time, usually a larger basket or a price change. Orders up while revenue is flat means more, smaller baskets, which is what a discount code tends to produce.
A flat stretch at the right hand end usually means orders stopped, not that the chart is broken. A single tall spike is as often one large trade order as a good day, and the Sales Report will tell you which.
Thirty days is not this month
The charts cover a rolling thirty days. The figures above them cover the calendar month. Comparing one against the other, especially early in a month, is the most common reason the dashboard appears to contradict itself.
The Row Along the Bottom

Pending, Processing and Shipped count orders by where they have got to, not by money. An order can be pending and paid, or processing and unpaid.
Pending is the one to watch day to day. A number that climbs is work arriving faster than it is going out. It is also worth checking what is sitting in it: a pending order that is weeks old is usually one waiting for a payment that is never going to arrive.
Low stock counts products at or below the threshold set on each one.
A product with no threshold never appears here
If low stock reads zero and you expected otherwise, check the thresholds rather than the stock. The figure is not counting things that are nearly out, it is counting things you told it to warn you about.
When a Number Looks Wrong
Nine times in ten it is one of four things.
An order you believe is paid is not. A refund you had forgotten about. A date range that does not mean what you assumed, usually this month against the last thirty days. Or a product whose stock was changed in two places at once.
The practical path: open the Sales Summary report, find the month in question, and compare the order count rather than the money first. If the counts match and the money does not, it is a refund or a partial refund. If the counts differ, it is an unpaid order.
What the Dashboard Is Not For
It is a glance, not a ledger. It answers whether today is going well. For anything you intend to act on, or give to a bookkeeper, use the reports, where you can set the date range yourself and export the result.